


Spotlight Weekly – The S&P 500 Keeps Setting New Records
In 2024, the S&P 500 keeps setting all time highs
It’s uncanny. And it honestly makes me a little nervous. Just look at this chart:
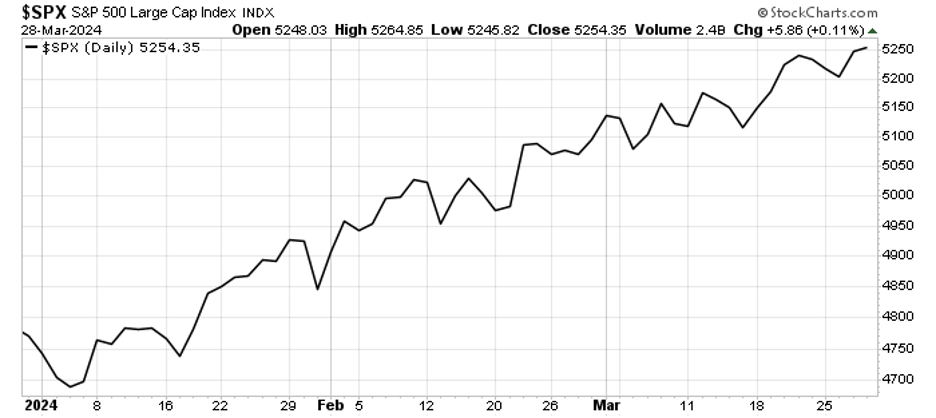
That’s an ideal stock chart. It’s so perfect, I can’t help but worry. The previous all-time high was 4796, set on January 3, 2022. The S&P 500 broke through that on January 19, 2024, when it closed at 4840.
As the chart above shows, it hasn’t looked back. The current value is 10% above that 2022 high.
To put that in perspective, it usually takes years for the index to rise 1,000 points:
- February 2, 1998 – 1,000 points
- August 26, 2014 – 2,000 points
- July 26, 2019 – 3,000 points
- April 1, 2021 – 4,000 points
- February 9, 2024 – 5,000 points
It took nearly three years for the S&P 500 to go from 4,000 to 5,000 points. Today, just a month after that milestone, it’s a quarter of the way to 6,000.
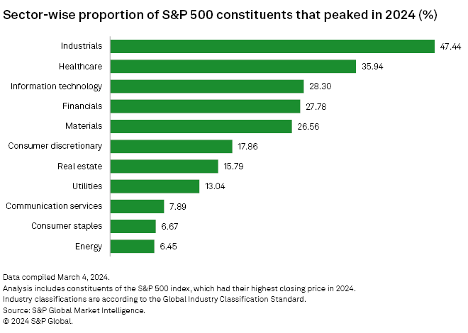
That’s fast. And it gives me the heeby jeebies. When markets get hot, the smart money begins to exit. And this is a hot market. According to S&P Global, 130 stocks (out of the 500) hit record highs in 2024. And while tech stocks like NVIDIA, Alphabet, Microsoft, and Meta Platforms get all the press, it was the industrials that led this rally.
A whopping forty-seven percent of the industrial portion are at all time highs. As opposed to just 28% of tech stocks. Here’s how the sectors break down, in terms of all time high’s:
While we’re not ready to call a top in the market, we should be cautious. Tighten your trailing stops and watch them closely. It’s time to protect our gains. We made money in this market, but it’s only on paper until we actually sell. Do not hesitate to sell your stocks if they hit our stops. Taking profits means we’ll have more cash to deploy on the next run.
For the Good,
The Mangrove Investor Team